Post by Victor VVV on Oct 21, 2018 11:08:18 GMT -5
======
Candlesticks
=====

=====
Long Lower Shadow Candlestick - Hit & Run Candlesticks
hitandruncandlesticks.com/long-lower-shadow-candlestick/
hitandruncandlesticks.com/long-lower-shadow-candlestick/
Before we dig into Long Lower Shadow candlesticks, let’s review how candlestick shadows/tails/wicks work. The body of a candle stretches to convey the interval’s opening price and closing price. The shadows, on the other hand, show the highest price and the lowest price of the interval. So when examining a candle with a long lower shadow, the tail represents the interval’s low.
* If a bearish candle has a long tail, you can see a great discrepancy between the closing price and the interval’s low.
* If a bullish candle has a long tail, you can see a great discrepancy between the opening price and the interval’s low.
* If a bearish candle has a long tail, you can see a great discrepancy between the closing price and the interval’s low.
* If a bullish candle has a long tail, you can see a great discrepancy between the opening price and the interval’s low.
Feb 18, 2016 - The Long Lower Shadow candlestick is typically considered bullish. When you spot it, look for surrounding candlestick patterns of which it may be a part. Good luck!
=====
Long Upper Shadow Candlestick
wiki.timetotrade.com/Long_Upper_Shadow_Candlestick
On the TimeToTrade charts, an indicator can be added to detect Long Upper Shadow Candlestick patterns. The indicator can then be used to execute trades, provide an Email or SMS text message notification when your Candlestick chart patterns have been met or backtest trading strategies.
A bullish or bearish candlestick whereby the length of the tail / lower shadow is at least two thirds of the total shadow length.
It is considered a weak bearish pattern and takes on greater significance when the market is over bought or at resistance.
=======
Hammer - Candlestick pattern
A hammer is a type of bullish reversal candlestick pattern, made up of just one candle, found in price charts of financial assets. The candle looks like a hammer, as it has a long lower wick and a short body at the top of the candlestick with little or no upper wick. Wikipedia
=========
Inverted hammer
The inverted hammer is a type of candlestick pattern found after a downtrend and is usually taken to be a trend-reversal signal. The inverted hammer looks like an upside down version of the hammer candlestick pattern, and when it appears in an uptrend is called a shooting star. Wikipedia
======

Spinning Top - Investopedia
www.investopedia.com/terms/s/spinning-top.asp
A spinning top is a candlestick pattern with a short real body that's vertically centered between long upper and lower shadows. Often times, the candlestick pattern is a sign of indecision about the future direction of the underlying asset.
======

Doji - Wikipedia
The doji is a commonly found pattern in a candlestick chart of financially traded assets (stocks, bonds, futures, etc.) in technical analysis. It is characterized by being small in length—meaning a small trading range—with an opening and closing price that are virtually equal.[1]
The doji represents indecision in the market. A doji is not as significant if the market is not clearly trending, as non-trending markets are inherently indicative of indecision. If the doji forms in an uptrend or downtrend, this is normally seen as significant, as it is a signal that the buyers are losing conviction when formed in an uptrend and a signal that sellers are losing conviction if seen in a downtrend.
The doji represents indecision in the market. A doji is not as significant if the market is not clearly trending, as non-trending markets are inherently indicative of indecision. If the doji forms in an uptrend or downtrend, this is normally seen as significant, as it is a signal that the buyers are losing conviction when formed in an uptrend and a signal that sellers are losing conviction if seen in a downtrend.
======

Dragonfly Doji - Investopedia
www.investopedia.com/terms/d/dragonfly-doji.asp
A Dragonfly Doji is a type of candlestick pattern that signals indecision among traders. It's formed when the security's high, open, and close prices are the same. The long lower shadow suggests that the forces of supply and demand are nearing a balance and the direction of the trend may be nearing a major turning point. For example, the Dragonfly Doji in the image below could signal a bullish reversal. The Dragonfly Doji is similar to the Long-Legged Doji and the Hammer candlestick patterns.
Gravestone Doji - Investopedia
www.investopedia.com/terms/g/gravestone-doji.asp
A gravestone doji is a bearish reversal candlestick pattern that is formed when the open, low, and closing prices are all near each other with a long upper shadow. The long upper shadow suggests that the bullish advance in the beginning of the session was overcome by bears by the end of the session, which often comes just before a longer term bearish downtrend.
======
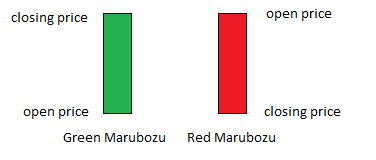
Marubozu Candlestick Pattern
July 11, 2015 by Ed Carter
Simplicity. It’s a lovely word and a very calming concept. After studying lots of complex candlestick patterns, it’s always nice to get back to the basics. Much like the Doji, the Marubozu candlestick pattern is a one-candle, easy-to-spot signal with a very clear meaning. It comes in both a bearish (red or black) and a bullish (green or white) form, and it commands attention with its long and sturdy shape. To learn more about how Marubozu candlesticks form, why they form, and what they can tell you about the current state of the market, please scroll down.
Simplicity. It’s a lovely word and a very calming concept. After studying lots of complex candlestick patterns, it’s always nice to get back to the basics. Much like the Doji, the Marubozu candlestick pattern is a one-candle, easy-to-spot signal with a very clear meaning. It comes in both a bearish (red or black) and a bullish (green or white) form, and it commands attention with its long and sturdy shape. To learn more about how Marubozu candlesticks form, why they form, and what they can tell you about the current state of the market, please scroll down.
Depending on where a Marubozu is located and what color it is, you can make predictions:
-If a White Marubozu occurs at the end of an uptrend, a continuation is likely.
-If a White Marubozu occurs at the end of a downtrend, a reversal is likely.
-If a Black Marubozu occurs at the end of a downtrend, a continuation is likely.
-If a Black Marubozu occurs at the end of an uptrend, a reversal is likely.
However, because these conjectures fail to provide 100% certainty, it is always best to confirm your suspicions by watching the candles that appear after the Marubozu. If the next few candles confirm your forecast (or if you spot another supportive candlestick pattern), feel free to move forward with confidence.
Marubozu is the name of a Japanese candlesticks formation used in technical analysis to indicate a stock has traded strongly in one direction throughout the session and closed at its high or low price of the day. A marubozu candle is represented only by a body; it has no wicks or shadows extending from the top or bottom of the candle. A white marubozu candle has a long white body and is formed when the open equals the low and the close equals the high.[1]
The white marubozu candle indicates that buyers controlled the price of the stock from the opening bell to the close of the day, and is considered very bullish.
A black marubozu candle has a long black body and is formed when the open equals the high and the close equals the low. A black marubozu indicates that sellers controlled the price from the opening bell to the close of the day, and is considered very bearish.
======