

Post by Victor VVV on Jan 29, 2020 17:16:19 GMT -5
Bull Flag Chart Pattern & Trading Strategies

What is a Bull Flag Pattern?
A bull flag pattern is a chart pattern that occurs when a stock is in a strong uptrend.
It is called a flag pattern because when you see it on a chart it looks like a flag on a
pole and since we are in an uptrend it is considered a bullish flag.
How to Day Trade Bull Flag Pattern
Warrior Trading
463K subscribers
Comments:
InLaws Attic
9 months ago (edited)
I am reviewing this weekend, loved the pro warrior coarse, love the chat room! I have one quick question, how to know when the set up should be watched on the one minute vs. the five minute? Is it just time of morning? Is it just speed at which the price is going up? Thanks, hope you are enjoying your weekend ! 👍🏻😊
Warrior Trading
9 months ago
Hey, Generally when a stock first starts making a move I watch the 1min, but once the breakout is well defined I switch back to the 5min.
A bullish flag pattern typically has the following features:
Stock has made a strong move up on high relative volume, forming the pole
Stock consolidates near the top of the pole on lighter volume, forming the flag
Stock breaks out of consolidation pattern on high relative volume to continue the trend
Bull Flags are a subset of our momentum trading strategy and can be used on any time frame.
We like trading bull flags on the 2 and 5-minute time frames as a way to scalp short-term
price movements.
However, they work just as good on daily charts too and are great for swing trading.
However, they work just as good on daily charts too and are great for swing trading.
Bull flag trading is fairly simple. The hardest part of trading this pattern is finding them but with
scanners like Trade-Ideas you can look for stocks that are surging up and then wait for a
consolidation pattern.
If you’re looking for free scanners to find bull flag patterns you can check out Finviz or Chartmill.

Checklist for trading bull flag patterns:
-Stock is surging up on high relative volume, preferably from a news catalyst.
Prices consolidate at or near highs with a defined pullback pattern.
-Stock is surging up on high relative volume, preferably from a news catalyst.
Prices consolidate at or near highs with a defined pullback pattern.
-Buy when prices breakout above the consolidation pattern on high volume.
-Place stop order below bottom of consolidation pattern.
-Profit targets should be at least 2:1 risk/reward. So if you are risking 25 cents, then first
PT is 50 cents from your entry price.
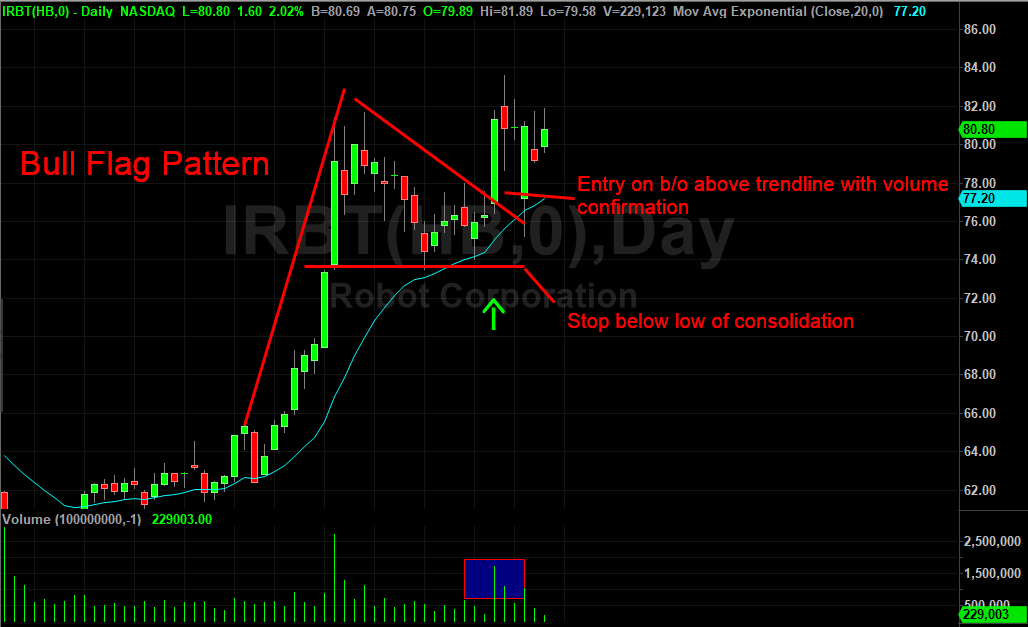
The main thing to look for in this pattern is volume. Volume confirms major moves and the
The main thing to look for in this pattern is volume. Volume confirms major moves and the
likely hood that a breakout will be successful.
The second thing you have to look for is a defined descending trend line that you can watch
The second thing you have to look for is a defined descending trend line that you can watch
as the point of breakout. This will be the top part of the flag. In the bullish flag pattern above
you can see that the trend line is very recognizable and defined so when it did finally punch
through price jumped up very quickly. You can also see how neatly the line connects to the
other moves up that were rejected (3 points of contact including the high of the flag pole).
Bull flag patterns do have a statistical edge if traded correctly but in the event the set up fails
Bull flag patterns do have a statistical edge if traded correctly but in the event the set up fails
you need to know where to get out. Or more definitively, the point on the chart where you
know that this set up is no longer working out and it’s time to jump ship.
There are a couple of different ways to manage this trade. The most common is to place a stop
There are a couple of different ways to manage this trade. The most common is to place a stop
below the consolidation area. In the example above, you can see the line drawn out on the
bottom of the flag pattern. This is the point where you know that this setup is no longer working
out and its time to take a loss and move on.
The other way is to use the 20-day moving average as a stop. So if prices close below that moving
The other way is to use the 20-day moving average as a stop. So if prices close below that moving
average then you would close out your position.
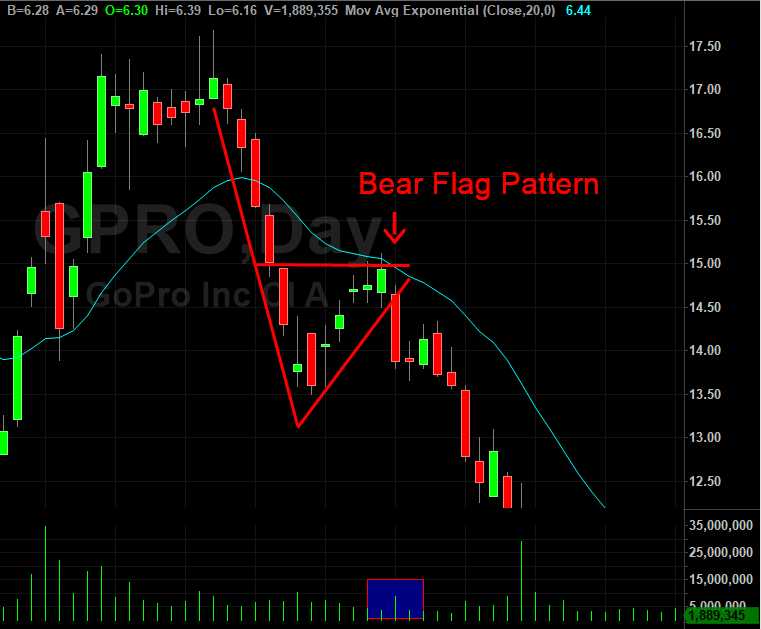
A bear flag is identical to a bull flag except the trend will be to the downside. You’ll have a sharp down
move on high relative volume followed by a slight pullback before continuing on the trend.

The key to trading flag patterns is following the volume. When volume comes in on the breakout,
you want to be jumping on board because this is confirmation that other traders were waiting for
the same thing and will increase the likelihood of success dramatically.
Bull Flag vs Flat Top Breakout
When I trade a bull flag stock pattern, the biggest difference from a flat top breakout is that the
Bull Flag vs Flat Top Breakout
When I trade a bull flag stock pattern, the biggest difference from a flat top breakout is that the
consolidation is occurring BELOW the high.
So as a flat top breakout consolidates within a few cents of the highs, a bull flag pattern experiences
So as a flat top breakout consolidates within a few cents of the highs, a bull flag pattern experiences
typically 2-3 red candles of pullback and can even pullback to the faster moving averages like the
8 or 10 EMA.
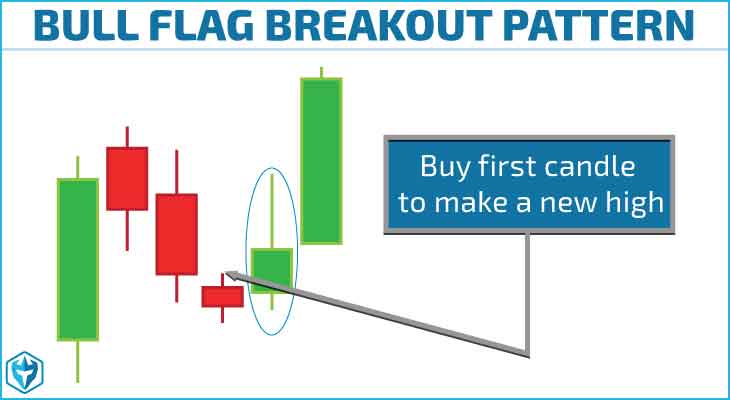
If we wait to buy the highs on the bull flag, we are chasing and a proper stop (at the low of the flag)
If we wait to buy the highs on the bull flag, we are chasing and a proper stop (at the low of the flag)
is too far away. So on a bull flag I buy the first candle to make a new high after the 2-3 red candles
of pullback.
I set my stop at the low of the flag which is usually pretty close by. This gives me a good risk reward
I set my stop at the low of the flag which is usually pretty close by. This gives me a good risk reward
ratio.
If I want to double my position on the high of day break and then sell through that spike I can make a
If I want to double my position on the high of day break and then sell through that spike I can make a
little more money. It’s important to be careful not to buy a double top.
If we have a big pullback, then squeeze right back to the highs we’ll sometimes see a double top
If we have a big pullback, then squeeze right back to the highs we’ll sometimes see a double top
formation, or a U shape on the chart. In the examples below you will see some perfect bull flags, but
you will also see some sloppier bull flags.
The most important thing is that we trade bull flags on the best stocks! It’s not about trading the best
The most important thing is that we trade bull flags on the best stocks! It’s not about trading the best
pattern, it’s about trading patterns on the strongest stocks.
www.warriortrading.com/bull-flag-trading/